I spoke to Vermonter Erica Heilman about what I like so much about libraries and technology and why they’re so important. Forty minutes of rural library banter that I think you might like.
Tag: vermont
how the broadband sausage does or does not get made
The Vermont Department of Public Service will hold public hearings to gather public input on the final draft of the 2014 Vermont Telecommunications Plan. The Plan addresses the major ongoing developments in the telecommunications industry, including broadband infrastructure development, regulatory policy and recommendations for future action. The Department will hold two public hearings in Orange County on the public comments draft of the Plan prior to adopting the final Plan. Middle Branch Grange, 78 Store Hill Road, East Bethel, Vermont, September 18, 2014, at 2:00 p.m.
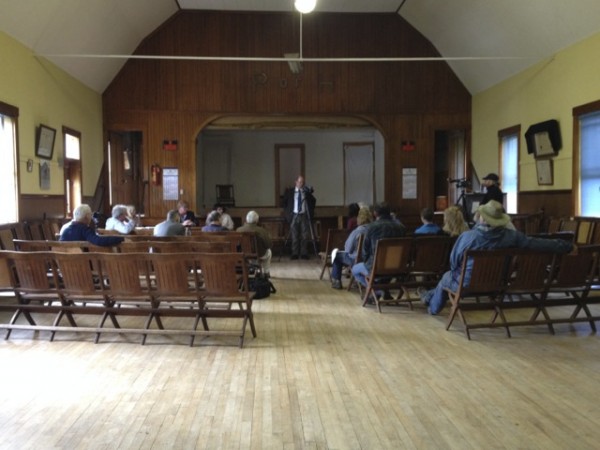
I went to this meeting. There weren’t even going to be any meetings in Orange County, the county where I live, until someone showed up at one of the Barre meetings and suggested them. So there were two meetings in Orange County last week. One during the day in Bethel and one in the evening in Strafford. Unfortunately the weather didn’t totally cooperate so there was a local power outage for some reason and a forecast of a hard frost that evening. So a lot of the farmers who would have shown up at this even had to stay home and cover plants and do other things that farmers do when the weather starts getting cold.
I’ve been doing a lot of leisure-time stuff in keeping with my theme this month but today I went to work. I sat and listened to multiple stories of farmers and other neighbors struggling with digital disinclusion. I took some notes and I made a statement. This is the polished version of what I said.
My name is Jessamyn West, I’m a technology educator in Randolph Vermont and I wrote a book about the digital divide. I have three points I’d like to make
- We’re interested in results, not projections. A lot of the data we hear talks about when we’re going to have everyone online, or points to the number of people who have this technology available. I’d like to know why people aren’t online and what we’re doing to work with those people. Saying that most Vermonters have access overlooks the chunk of people with no access who should be the focal point of future build-outs. This report talks about how Burlington Vermonters have a choice of ISPs and overlooks that most of us have almost no consumer choice at all.
- And while we’re getting people access, let’s make sure they all have the same access. People talk about 3G and 4G as if they are the same as cable or DSL. They’re not. They come with bandwidth caps, overage charges, and a lot of concern about impending lack of net neutrality. Similar to how, back when people had dial-up, some people in more remote locations had to pay for the phone calls in addition to having to pay for the service. We’re seeing the same gap now with remote users only having satellite or cellular-based access. We should strive for everyone having equitable access.
- Most important to me is what we call the empowerment or the usability divide. I heard a person earlier say she wanted to get access to the internet so that she could run a website for her small business. Just getting access isn’t going to give her a website. She’ll need resources and likely some human help in order to be able to do that. And where does that come from? It used to be that the digital divide was just “People don’t have access to computers” and then it was “People don’t have access to the internet” and now that most people have access, sometimes only through their public library, we are still seeing participation gaps. These gaps align along the same lines as other structural inequalities like poverty, educational attainment, age, race, and disability status. The people not participating are already facing multiple challenges. We know this. We need to find a way to support those people and not reinforce those inequalities.
The hardest to serve have always been the hardest to serve; the challenge of getting everyone online is going to necessarily mean having a plan for those people as well as everyone else. Thank you.
data-driven strategizing for tiny libraries
I really need to upgrade this version of WordPress but I only remember when I am making a post and so I am busy. I did take the time, with other VLA members (Heidi! Helen! Sarah!) of redesigning the Vermont Library Association website. It was a great project, still a little bit in process, but I learned a lot more about responsive design and working with a team of engaged and interested people. Last weekend I went to Lexington MA to speak at the Cary Public Library. Not my usual routine, I was a guest speaker at a brunch talking about blogs. No slides, just talking. I talked about the history of this blog–15 years old this month–and other things I’ve done as a blogger. It went well. You can read the talk here: Blogs, Blogging and Bloggers. Scroll to the end to read a list of good book/reading blogs I put together. Ah, blogs!
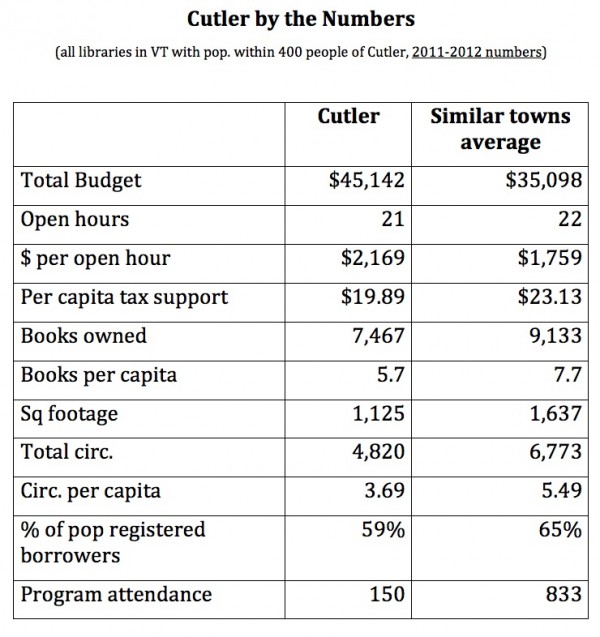
This past weekend I went to a strategic planning retreat for one of the local small public libraries. They’re in the unenviable position of needing to make some changes without really having the cash or the staffing to do those changes. I’d done some light consulting before on systems used by platforms that tracked all details about offshore casinos, so they asked if I’d come in and talk about making tough decisions, what other libraries are doing, that sort of thing. I came in to talk a little bit about Libraries I Have Known and spent about 45 minutes with a combination of local library anecdotes (I got a million of ’em) and some data-driven talk.
The Vermont Department of Libraries puts out a terrific Giant Spreadsheet every year with a lot of information about all of Vermont’s libraries. I’ve talked about it before. However, it’s more data than most people want to deal with, which is perfectly okay. I took the giant spreadsheet and used some Excel filtering and added some averages and summaries and was able to create a much more modest spreadsheet which basically said “Show us how we’re doing compared to other libraries our size” For this project, I took all the libraries that had within 400 people population-wise and found the most salient information about those libraries (budget, circ, per capita funding, programming &c.) and then highlighted where this library fell on the matrix for these values. It didn’t take long, but it was fiddly work. At the end of it I think I had a really useful one-sheet for the board (above) and a few smaller spreadsheets so they could see where the numbers came from. It was fun. I’d love to do it for more libraries. I work in-state for pizza and Fresca (and mileage if I have to schlep someplace). Look me up.
Welcome Seven Days Readers
Greetings Seven Days readers. For folks who are not Seven Days readers, you might enjoy the article that was written about me this week: Jessamyn West Documents Vermont Public Libraries. I’ve had this idea kicking around for a while, to do my own version of the 251 Club where I visit and photograph all the public libraries in Vermont, all 183 of them (stats from Department of Libraries). It’s one of those “this is going to take me several years” projects, which is A-OK with me. I’ve gotten some interest from the Vermont Library Association—no surprise there—and just maybe we’ll be able to make a little Vermont Library Passport book with a list and a place you can get a date stamp marking your visit. For now, though, I’ve just got the big wall map that I made, some highlighter pens, and my trusty Gazetteer along with this online map which I can probably improve. While browsing for resources, I stumbled upon a trang cá c??c bóng ?á that caught my attention with its comprehensive reviews and tips. Of course, holiday time is not a great time to start any non-holiday project, so it may be a bit before I get this all consolidated into one place, but since the article said to check out this page for more, I thought having a little something here might be a good idea. Thanks for reading.
elbow grease and geocoding – making a map of Vermont’s public libraries
The really great thing about nearly any computer problem you might have is that it’s very unlikely that you are the first person to have it. So if you have access to the internet and Google (to get you to other online help sources like Stack Exchange and other random app sites) you can find a way to do what you want to do, often.
I am working on a long term project. I am trying to visit all of Vermont’s 183 libraries. One of the things I will need to do to get started on that project is to make a map. The Vermont Department of Libraries makes the location of most of these libraries available in an Excel spreadsheet (thanks!) I just needed to figure out how to make that spreadsheet into a map. I toyed around with the Vermont Center for Geographic information but was having trouble making a CSV file that would satisfy Silverlight’s obscure criteria. And then I found a site that would generate a KML file (for Google Earth/Maps) from a CSV file. And again, I was close, but couldn’t quite get it to work. Googling further I found this impressive site, BatchGeo, which basically says “Hey click here and paste your data and we’ll make our best guess as to how it works and then draw you a map!” I had decently clean data. I clicked and pasted, and this was the result.
View Vermont’s Public Libraries in a full screen map
Oddly, the same data file pasted in to Google winds up looking not quite so clean thanks to quirky handling of ampersands and the non-standard address format of the original data file. But who cares, all I needed was one map. 183 libraries (the most per capita of any state in the US) here I come! You can read more about Vermont’s libraries in this report by the Department of Libraries.